
Data from the 2010 Census show that young children (ages 0 to 4) had a net undercount rate of 4.6 percent, which is far higher than the net undercount rates for any other age group. In addition, young Black and Hispanic children had net undercount rates around 7 percent, and O’Hare (2015) found that they are missed more often than young Non-Hispanic White children. That is why correctly counting young minority children is a high priority in the 2020 Census.
In February 2020, the Population Reference Bureau (PRB) analyzed data for the 689 counties across the country where there were at least 5,000 children ages 0 to 4 in 2010. The analysis identified census tracts that are likely to have a high net undercount of young children in the 2020 Census (O’Hare et al. 2020). The PRB report showed that the young children living in these high-risk census tracts were more likely to be racial or ethnic minorities (O’Hare et al. 2020).
In June 2020, PRB released a new database that couples the risk of young child undercounts with regularly updated self-response rates from the 2020 Census (PRB 2020). Self-response rates measure the proportion of housing units that have responded to the census, providing a key measure of how the census is unfolding in real time. Keep in mind that some housing units do not respond because they are not occupied. This database includes self-response rates for all 84,000 census tracts in the nation, but only those tracts in counties with at least 5,000 young children in 2010 have a risk of young child undercount code.
This blog uses the most recent 2020 Census self-response rates in combination with data on the racial and ethnic composition of young children and the risk of young child undercounts in tracts. Figure 1 uses data from all 84,000 Census tracts in the country, and Table 1 focuses on a subset of tracts that have a very high risk of undercounting young children and very low self-response rates. The racial/ethnic data in this analysis are based on tract-level estimates from the 2014 to 2018 American Community Survey. These are the most recent tract-level data on racial/ethnic composition available.
Figure 1 shows the mean self-response rates for census tracts where young minority children are the majority of the young child population in the tract. A separate category shows the average self-response rate for census tracts where no major racial/ethnic group is the majority of the population ages 0 to 4.
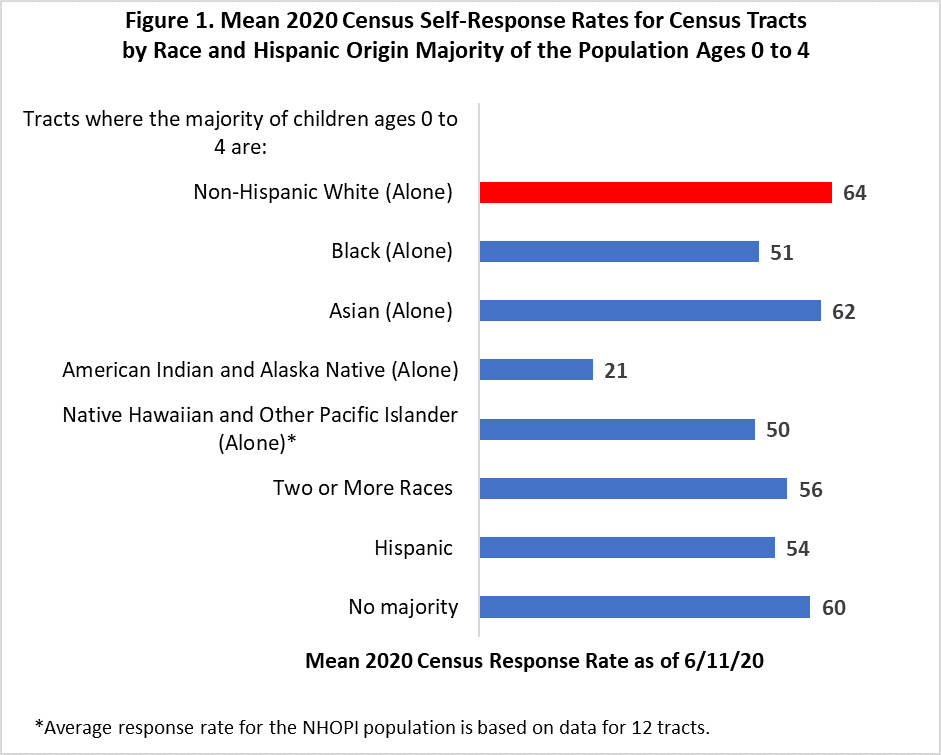
The mean self-response rates shown in Figure 1 exhibit a lot of variation. However, it is noteworthy that the mean self-response rates for all tracts where racial/ethnic minorities are the majority of young children are lower than the mean self-response rates for tracts where Non-Hispanic White children are the majority (64 percent).The very low self-response rates for American Indians/Alaska Natives (21 percent) probably reflects the delayed start to delivering census materials in many rural areas (the Update Leave operation) because of the coronavirus pandemic. Many Indian reservations were impacted by this health crisis.
In tracts where the two largest minority groups (Hispanics and Blacks) are the majority of the population ages 0 to 4, the mean self-response rates are at least 10 percentage points behind those for tracts where Non-Hispanic Whites are the majority of the young child population.
There is another way to look at these data. Sometimes averages mask important outliers or extreme values in a distribution. It is important to look at outliers where the self-response rates are extremely low. We believe that an accurate count in the 2020 Census may be especially problematic for young children in these areas. Below, we identify the most problematic tracts and the racial and ethnic composition of those tracts.
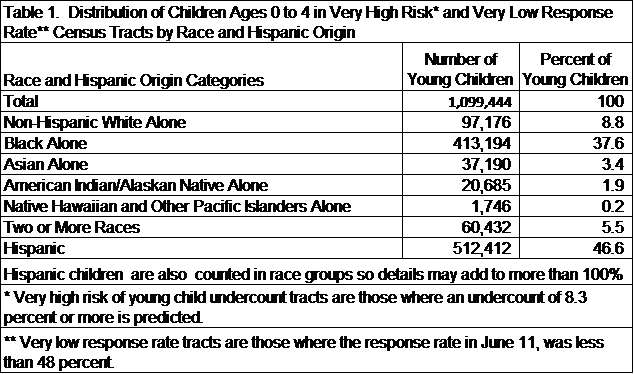
To examine the data from this perspective a category of census tracts was developed that combines the tract-level risk of young child undercounts with the tract-level 2020 Census self-response rates. Table 1 shows how young minority children are concentrated in the very-high-risk and very-low-response tracts. These are census tracts where an undercount of 8.3 percent or more is predicted and where the self-response rate is less than 48 percent (as of June 11).
The data in Table 1 show that young minority children comprise more than 90 percent of the young children living in these types of particularly vulnerable tracts. On the other hand, only 8.8 percent of the young children in these tracts are Non-Hispanic White children. Almost half (46.6 percent) of the children in these tracts are Hispanic and more than one third (37.6 percent) are Black.
The data presented in Figure 1 and Table 1 indicate that young minority children are particularly vulnerable to being missed in the 2020 Census and suggest special efforts should be made over the next few months to increase self-response rates in census tracts with large numbers of young minority children.
It is important to remember that these response rates reflect responses at the census tract level rather than the household level. Data are not available to directly measure the 2020 Census response rate by race. So, the relationship between minority status and self-response rates in this analysis is implied rather than measured directly.
The data shown here reflect nationwide trends and patterns, but there is a lot of diversity across the county and even within large urban areas. To help target areas for outreach, PRB has developed a database that can be used to identify tracts with a very high risk of undercounting young children, low self-response rates, and high concentrations of young minority children. In the next few weeks, PRB plans to release additional tables and a series of maps that will highlight data for specific minority groups living in those tracts.
References
O’Hare, W.P. (2015). The Undercount of Young Children in the U.S. Decennial Census. Springer Publishers. https://www.springer.com/gp/book/9783319189161.
O’Hare W.P., Jacobsen, L.A., Mather, M. and VanOrman, A. (2020). Predicting Tract-Level Net Undercount Risk for Young Children. The Population Reference Bureau, Washington, DC. https://www.prb.org/wp-content/uploads/2020/02/us-census-undercount-of-children.pdf.
Population Reference Bureau (2020b). PRB Resources to Improve the Count of Young Children in the 2020 Census (June 11 Update). https://countallkids.org/prb-resources-to-improve-the-count-of-young-children-in-the-2020-census-june-11-update/.