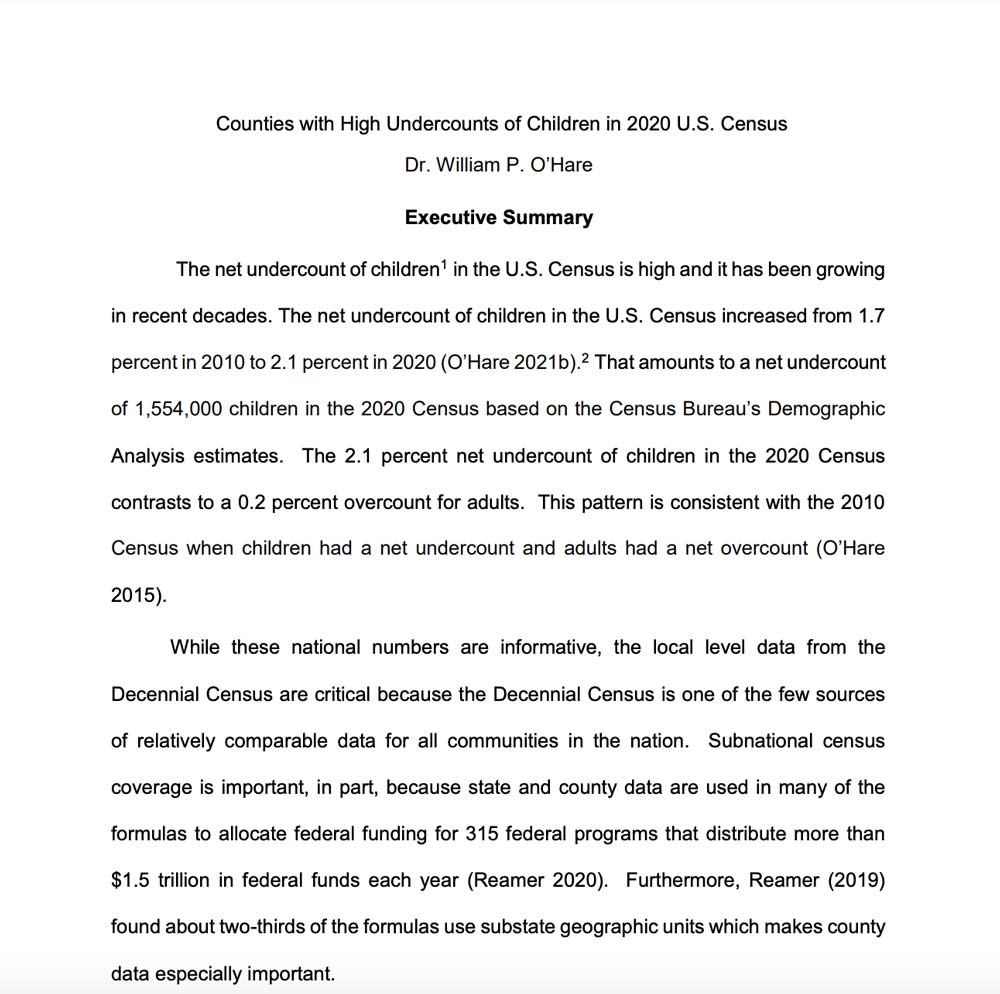
The undercount of children in the U.S. Census is high and it has been growing. The undercount of children increased from 1.7 percent in 2010 to 2.1 percent in 2020 (O’Hare 2021a). That amounts to a net undercount of 1,554,000 children in the 2020 Census based on the Census Bureau’s Demographic Analysis estimates. The 2.1 percent undercount of children in the 2020 Census contrasts to a 0.2 percent overcount for adults. The net overcount of adults in the 2020 Census amounts to about 400,000 people based on the Census Bureau’s Demographic Analysis. This pattern is consistent with the 2010 Census where children had a net undercount and adults had a net overcount (O’Hare 2015). The gap in census coverage in the 2020 Census contrast sharply to the 1990 Census where these two age groups had census coverage rates that were nearly identical.
Given the relatively high nationwide undercount rate for children, it would be useful to have a better understanding of the geographic distribution of problems in census coverage for children. An understanding of the geographic distribution of undercounted children might help pinpoint reasons why they have a high and increasing undercount in the Census and help us prepare for the 2030 Census.
The methodology employed here provides one of the few opportunities to generate substate accuracy data for the 2020 Census. The Census Bureau does not plan to produce substate or local measures of accuracy for children in the 2020 census using either of the two main methods the Census Bureau uses to assess Census accuracy (Post-Enumeration Survey and Demographic Analysis).[1] This is unfortunate because many stakeholders are seeking substate measures of census quality (National Academy of Sciences 2022; American Statistical Association 2021; U.S. Census Bureau 2022c; U.S. Census Bureau, 2014; National Association of Latino Elected Official Education Fund 2022; Adlakha et al. 2003). The present analysis responds to the desire for more subnational census accuracy measures.
This study addresses the geographic variation in census coverage of children by examining the undercount estimates for children for all counties or county equivalents in the U.S. Subnational census coverage is important, in part, because state and county data are used to allocate federal funding in most of the 315 federal programs that distribute more than $1.5 trillion in federal funds each year (Reamer 2020). Reamers found about two-thirds of the formulas use substate geographic units which makes county data very important.
It is also important to study counties because state-wide numbers can mask big differences within a state. For example, one set of counties may have high undercounts, but that can be counter-balanced by another set of counties with high overcounts leading to low overall coverage error for the state. U.S. Census Bureau (2014) found nearly all the undercounts of young children (ages 0 to 4) in the 2010 Census in New York and Illinois were accounted for by the largest counties in those two states.
Some studies from past censuses have focused on subnational accuracy assessment of the U.S. Census, but results are limited with respect to patterns revealed and provided little information on the undercount of children (Siegel et al. 1977; Robinson et al. 1993; Cohn 2011; Mayol-Garcia and Robinson 2011; O’Hare 2014 and 2017). The present analysis extends previous work by examining 2020 county-level census coverage rates for the population age 0 to 17.
According to the Census Bureau (Jensen and Johnson 2021, page 7), “Both the 2020 DA estimates and the Vintage 2020 population estimates can be used as demographic benchmarks for evaluating certain aspects of the 2020 Census results”. The DA results available at this time are only available at the national level so that source of data cannot be used to study census coverage in counties.
In this study, Census counts are compared to Census Bureau Vintage 2020 population estimates to determine differences or errors.[2] This study is closely linked to a recent report from the Census Bureau by Jensen and Johnson (2021) which compared 2020 Census results and Vintage 2020 Population Estimates to assess the 2020 Census data quality for children at the county level. According to Jensen and Johnson (2021) “Increasingly, data users are comparing the population estimates to the results of the 2020 Census to try and understand the quality of the census results.” This study adds to that stream of research.
The current study uses the same methodology as Jensen and Johnson (2021) with three major differences First, the Jensen and Johnson study focused on differences between the 2020 Census and the population estimates but they do not frame the differences as coverage error as I do. Second, the Jensen and Johnson study only looked at percent differences while this study examined percent and numeric differences. Third, the Jenson and Johnson study examined differences for all counties, but this study only focuses on counties with a high net child undercount.
It is worth noting that some of the differences found here may be important even if differences do not reflect true undercounts. According to the U.S. Census Bureau (2021, page 2), “significant or unexpected differences can be useful for identifying areas for further investigation.” A difference between the Census count and the estimates may signal a problem with the underlying data.
In this study, the PEP estimates are viewed as more accurate than the Census counts for children based on a couple of factors. First, the PEP data for ages 0 to 9 are derived largely from birth and death records, and these records are widely recognized to be very accurate.
Second, the 2020 census counts have large undercounts for a substantial portion of the 0 to 17 age group. Given questions about the quality of the 2020 Census data, and the consistent undercount of children in the census, it is likely that the population estimates for children may be more accurate than the 2020 Census counts.
Third, only the largest differences are examined here, and large differences are likely to reflect the correct direction if not the correct net undercount magnitude. This approach discounts small random errors that might impact this methodological approach for all counties. It should also be noted that most of the counties with a net child undercount estimates of 5 percent or more have undercounts much higher than 5 percent. Of the 343 counties with a net child undercount of 5 percent or more, 35 (121/343) percent have net child undercounts of 10 percent or more. Of the 225 counties with a high net child undercount greater than 500, 49 percent (110/225) have net child undercounts of 1000.
Given the potential errors in the Census counts and the PEP estimates, a small difference between the PEP estimates and the Census count for a county does not necessarily reflect a true undercount or an overcount. In this study I focus on large errors which provides more assurance that they are real errors and in the right direction.
[1] The Census Bureau is planning an experimental DA series which will provide net coverage rates for children age 0 to 4 for states and counties. It is not clear when this data will become available.
[2] Vintage 2020 refers to the year referenced in the data, not the year the data was released.


