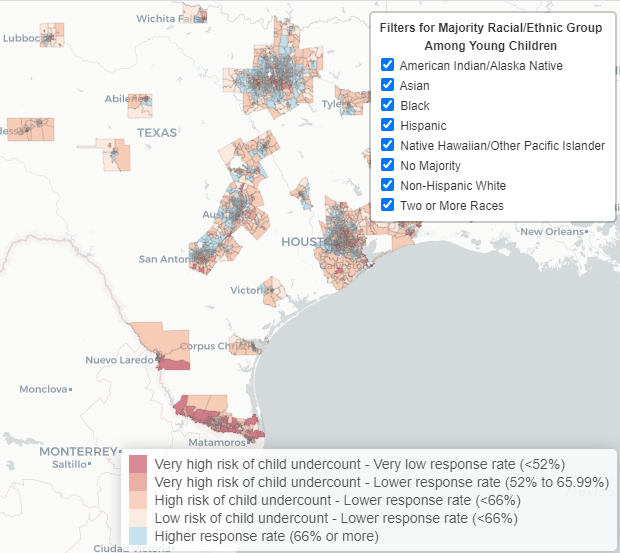
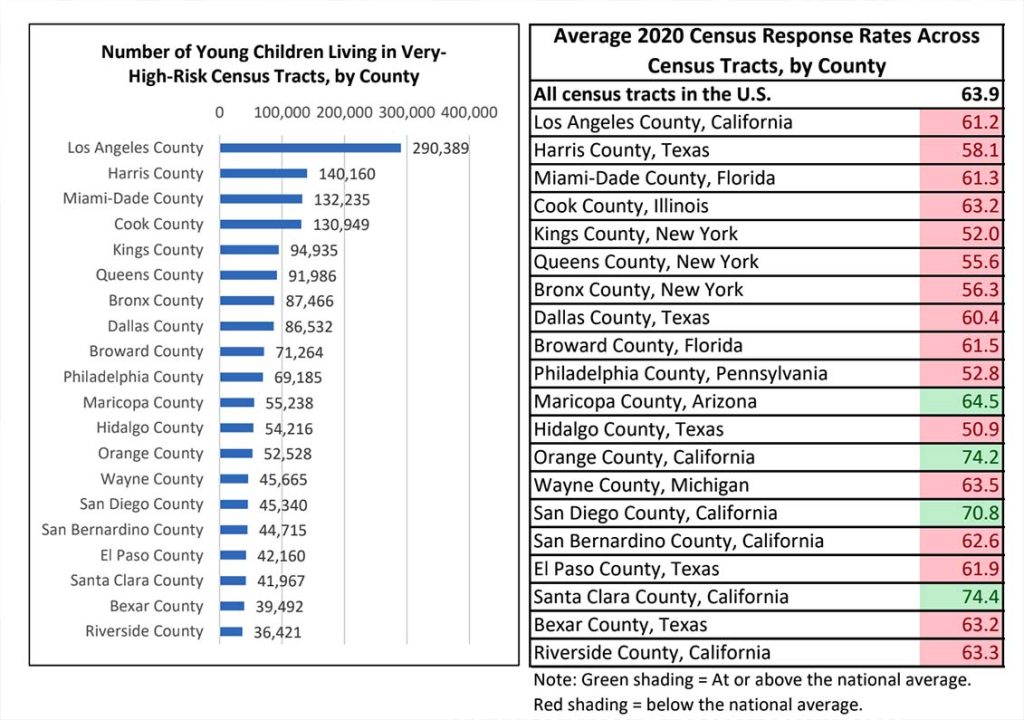
PRB has produced an updated series of tables and maps identifying neighborhoods with a very high risk of undercounting young children in combination with low 2020 Census self-response rates. As of October 16—the final day for self-response—the average self-response rate in census tracts with a very high risk of undercounting children under the age of 5 was 62%, while the mean self-response rate in tracts with a low risk of undercounting young children—or a potential net overcount—was much higher, at 74%. The mean response rate across all census tracts in the United States was 67%.
Recently, the Census Bureau also began to release daily NRFU completion rates by area census office. These data represent the completion rates for the Nonresponse Followup workload, which is the households that have not self-responded as well as other case types that are used to improve the accuracy of the census, such as quality control cases.
The self-response data and maps provided by PRB show the percentage of housing units that self-responded online, by phone, or by returning a completed paper questionnaire.
You can access the tables and maps here. To view the maps, download the google document and open the downloaded html.
I want to thank the Annie E. Casey Foundation and the Partnership for America’s Children for supporting this work. I also want to thank my PRB colleagues Alicia VanOrman and Matthew Martinez for their behind-the-scenes work to develop and update these data and maps.
