
We are thrilled to announce that the Population Reference Bureau (PRB) has produced new data that can help focus young child census outreach campaigns more effectively. For some race groups, for example Asians, data on census undercounts or risk of undercounts are only available for the group as a whole. This approach overlooks many differences among smaller subgroups that are important in assessing the undercount risk for young children in those subgroups. The new data produced by PRB addresses these differences among smaller groups by producing Risk of Undercounting profiles for young children (under age 10) in many smaller groups.
Demographers know that certain factors are closely correlated with the risk of young children being missed in the census. Eight of these factors are:
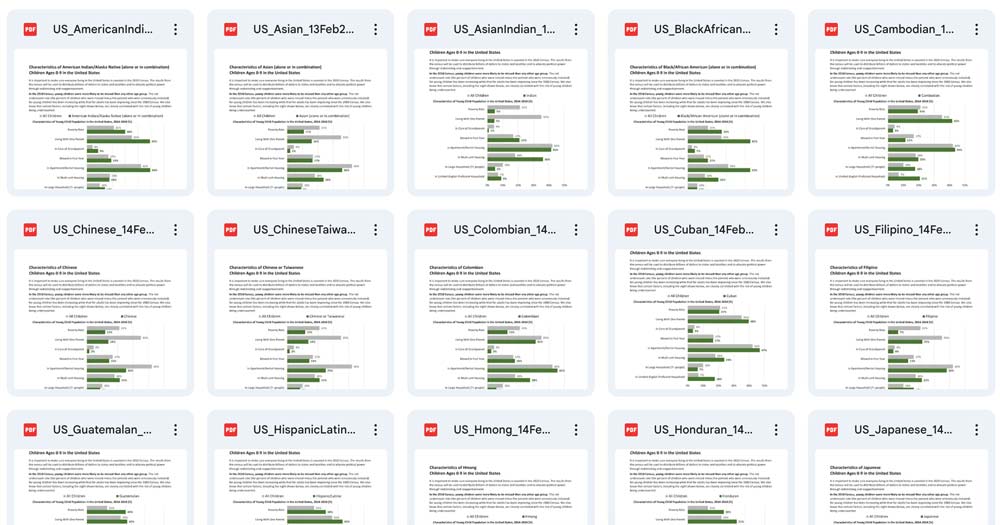
• Poverty rate
• Living with one parent
• Living in care of grandparent
• Moved in the past year
• Living in an apartment/rental housing
• Living in multi-unit housing
• Living in a large household (7+ people)
• Living in a limited-English proficient household
Because different racial and ethnic subgroups may have quite different family structures and housing situations, PRB has analyzed these eight factors for 29 different racial and ethnic subgroups (see list of groups below). By providing data for very precise targeted groups, we hope that this will help you conduct more effective census outreach. Each of these factors may suggest a different outreach strategy. For example, for groups with very high poverty rates, you may want to conduct outreach with programs such as WIC, and also work with groups serving the homeless. For populations where many children are in the care of grandparents, you may want to reach out to senior citizen programs, grandfamily organizations, and other organizations serving these grandparents. For communities with large households or with a high share of children living in rental housing, you may want to emphasize messages that the landlord will never learn how many people are on the form.
The 29 populations are:
-
- American Indian/Alaskan Native (alone, or in combination)
- Asian (alone, or in combination)
- Chinese or Taiwanese (alone)
- Chinese (alone)
- Asian Indian (alone)
- Filipino (alone)
- Vietnamese (alone)
- Korean (alone)
- Hmong (alone)
- Japanese (alone)
- Pakistani (alone)
- Cambodian (alone)
- Taiwanese (alone)
- Black/African American (alone, or in combination)
- Hispanic/Latino
- Mexican
- Salvadoran
- Guatemalan
- Puerto Rican
- Spaniard
- Nicaraguan
- Honduran
- Cuban
- Peruvian
- Columbian
- Other Hispanic
- Multiracial
- Native Hawaiian/Other Pacific Islander (alone, or in combination)
- White (non-Hispanic, alone)
The data files for the United States are available in PDF here. The files for California are here. These files may be easier to access on a google chrome browser. If you would like access to them in MS Excel, please email Jasmine Jones at jjones@foramericaschildren.org. Let her know why you want access to them in Excel.