Earlier this month, two new reports were released indicating children in general (population ages 0 to 17) and young children (population ages 0 to 4) in particular were undercounted at a high rate in the 2020 Census. In examining net undercount rates for all children, it is important to remember the net undercount of young children has been much higher than that for all children for the last 60 years. For example, in the 2010 Census, the net undercount rate for young children was 4.6 percent compared to 1.7 percent for all children.
On November 2, the Urban Institute (2021) issued a report on likely miscounts in the 2020 Census based on a novel approach using microdata. They present the findings as one more data point that can be used to evaluate the 2020 Census. One advantage of the Urban Institue approach is the ability to produce data for detailed demographic groups including state populations. For example, the Urban Institute report is the first to estimate net undercounts for young children in the 2020 Census and they provdie data for each state on their website (https://www.urban.org/policy-centers/center-labor-human-services-and-population/projects/exploring-2020-censuss-accuracy-and-utility). They also estimate omissions and overcounts as well as net coverage.
The Urban Institute report (Table 2) indicates they expect to see a net undercount of young children in the 2020 Census of 4.86 percent based on a projected omissions rate of 8.99 percent and a double-counting rate of 4.13 percent (what call double-counting is technically called erroneous enumeration). On their website, they make state-level data available including the net undercount of young children.
The high estimated net undercount of young children seems plausible, but I suspect the magnitude of their estimates of the net undercount for young children may be too low for the reasons spelled out below.
In an earlier study by the Urban Institute (2019), they estimated the net undercount of young children in the 2020 Census could be as high as 6.3 percent and that was before the pandemic, natural disasters, and political interference experienced in the 2020 Census. In addition, the estimated net undercount of young children in the 2020 Census (4.86) percent) is only slightly higher than the net undercount observed in the 2010 Census which was 4.6 percent (O’Hare 2015) and there is growing evidence that the data from the 2020 Census will be much worse than that from 2010 for many vulnerable population segments. For example, there is evidence the net undercount for Black and Hispanic children (ages 0 to 17) more than doubled between 2010 and 2020 (O’Hare 2021). In addition, data from the Population Reference Bureau (2020) found that the mean self-response rate for census tracts where young children were predicted to have a very high net undercount (61.7 percent) was substantially lower than the average rate (66.8 percent). This is important because data from self-response is more accurate than census data derived from other sources. Also, about one-seventh of the census tracts where young children were predicted to have a very high net undercount were tracts where the self-response rates declined by ten percentage points or more between 2010 and 2020
On November 9, the U.S. Census Bureau (2021) released a blog with more information about the accuracy of 2020 Census data on children. They indicate the net undercount for all children (population ages 0 to 17) was 2.08 percent based on the middle series of their three sets of Demographic Analysis estimates. This is higher than the rate of 1.7 percent using similar data from the 2010 Census. They also indicate an expected net undercount of 4.25 percent of Hispanic children based on the middle series DA estimate.

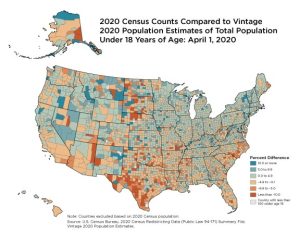
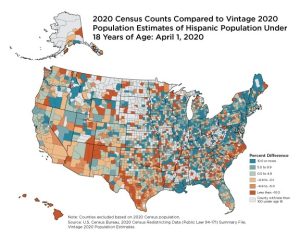
They also presented data comparing the 2020 Census counts to the 2020 population estimates for counties. They provide comparisons for all children and for Hispanic children in the form of the two maps shown below.
As the authors explain in the blog, one should not compare data on the Black population in the estimates to the census counts, because the Census has a “some other race” category while the estimates do not. The report explains how the Census Bureau will be constructing a modified race file to make categories in the Census consistent with those from birth and death certificate data used to produce the estimates. On the other hand, the definition for the Hispanic category is consistent between the two data sets.
There are some reasons to believe the population estimates may be more accurate than the census counts. For example, the population estimates for ages 0 to 9 in 2020 are based on vital events data (mostly birth certificates) and those are thought to be very high quality data while the census data are very likely to have net undercounts for children based on past analysis.
Figure 1 shows county-level data for all children. As the authors of the blog point out, there is a striking regional overlay to the results for all children. The blog authors state (U.S. Census Bureau no page number),
“For example, the 2020 Census counts for the population under age 18 were higher than the estimates in much of the Northeast and Upper Midwest, while the census counts for this population were lower than the estimates in many counties in the South, Southwest, and Great Plains.”
Figure 1. 2020 Census Counts Compared to Vintage 2020 Population Estimates of Total Population Under 18 Years of Age: April 1, 2020

Figure 2 shows similar data for Hispanic children. There is a similar regional overlay as seen in Figure 1. Some of the extreme values shown in Figure 2 may be the results of small numbers of Hispanic children in counties, which can translate into high percentages.
Figure 2.

In summary, with these two new reports, a broad picture of 2020 Census accuracy is coming into focus. For the overall population and for many segments of the population, the data from the 2020 Census looks pretty good. For other groups, including children, and minority children in particular, the evidence so far is worrisome.
References
O’Hare, W. P (2021). “The High Net Undercount of Black and Hispanic Children in the 2020 Census,” Count All Kids website https://secureservercdn.net/198.71.233.229/2hj.858.myftpupload.com/wp-content/uploads/2021/10/High-Net-Undercount-of-Black-and-Hispanic-Children-in-teh-2020-Census-10-4-2021.pdf
O’Hare W.P. (2021). “CENSUS DATA RELEASE SHOWS THE 2020 CENSUS HAD A HIGHER NET UNDERCOUNT OF CHILDREN THAN IN 2010,” Count All Kids Website, https://secureservercdn.net/198.71.189.253/r75.9ab.myftpupload.com/wp-content/uploads/2021/08/First-Data-on-the-Coverage-of-Children-in-the-2020-Census-FINAL-1.pdf
Population Reference Bureau (2020). “2020 Census Self-Response Rates by Risk of Undercounting Young Children, October 8, 2020 to October, 16, 2020.”
Urban institue (2021). “Simulating the 2020 Census: Miscounts and the Fairness of Outcomes,” Diana Elliott, Steve Martin, Jessica Shakespeare, and Jessica Kelly, The Urban Insitute, Washington, DC. https://www.urban.org/research/publication/simulating-2020-census-miscounts-and-fairness-outcomes
Urban Institue (2019). “Assessing Miscounts in the 2020 Census” Diana Elliott Rob Santos, Steve Martin, and Charmaine, Runes The Urban Insitute, Washington, DC. https://www.urban.org/research/publication/assessing-miscounts-2020-census
U..S. Census Bureau (2021) Using Demographic Benchmarks to Help Evaluate 2020 Census Results, Written by Eric Jensen and Sandra Johnsonhttps://www.census.gov/newsroom/blogs/random-samplings/2021/11/demographic-benchmarks-2020-census.html


