PRB has produced an updated series of tables and maps identifying neighborhoods with a very high risk of undercounting young children in combination with low 2020 Census self-response rates. The new data and maps are based on response rates as of July 16.
We also added new functionality to the maps to make data for different racial/ethnic groups more accessible. Use the filters in the upper right corner of each map to display census tracts where different racial/ethnic groups make up the majority of children under age 5.
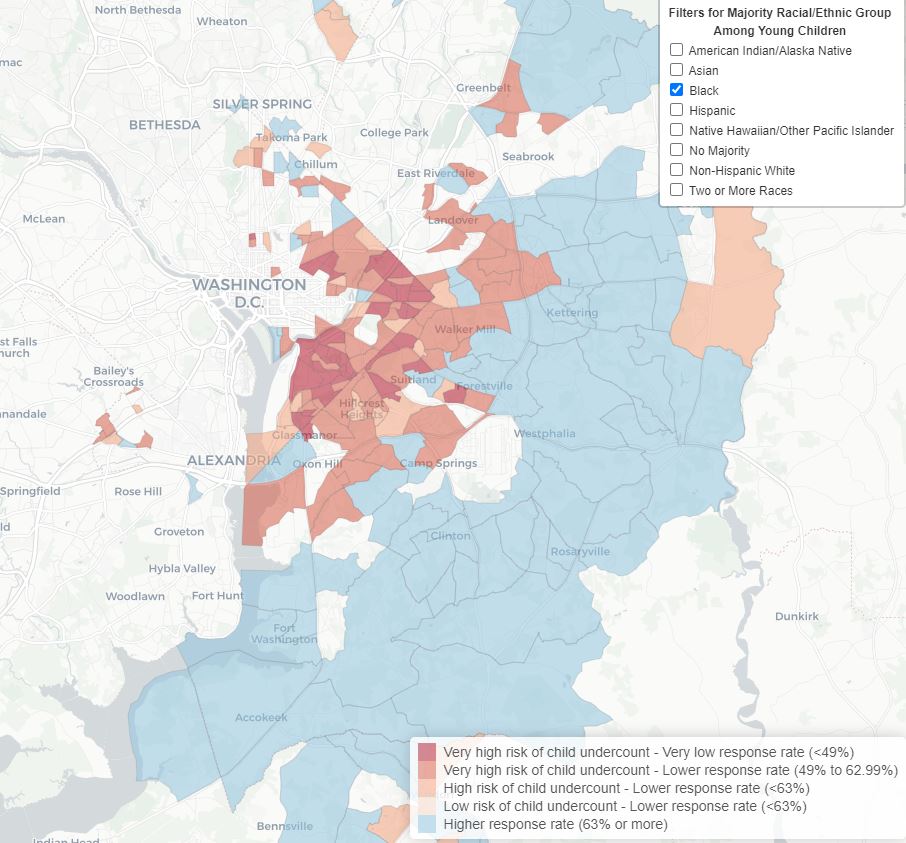
Here is a sample map of the Washington, DC area, displaying undercount risk and self-response rates in census tracts where the majority of children under age 5 are Black.
In some neighborhoods, no single racial/ethnic group constitutes a majority of the young child population. We classified these census tracts as “No Majority.” Use the tract-level database to access more detailed information about the racial/ethnic composition of the young child population in each neighborhood.
You can access the tables and maps here. To view the maps, download the google document and open the downloaded html.