
The Child Health Advocacy Institute of Children’s National Hospital in Washington, DC has spent the last year preparing for the Census. Realizing how important healthcare providers are in communicating the message to families of young children, we quickly jumped into action. Then the COVID-19 pandemic hit and our strategies to engage families of our youngest patients were forced to change. We knew at the start of self-response which neighborhoods were at increased risk for undercounting young children and worked within our clinics and partner organizations to spread the word there. However, as self-response waned and with the newest supplemental data from the Population Reference Bureau (PRB), we shifted our strategy to maximize our reach. We owe a debt of gratitude to the organizations and individuals making this timely data available to us. Thank you. We could not do this otherwise.
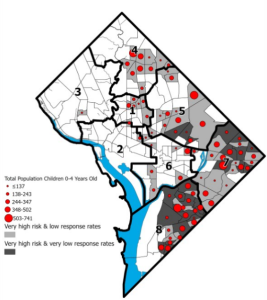
According to the newest PRB data release and in light of recent changes to census operations, we created a strategy to hone in on neighborhoods lagging behind in self-response and where a lot of young children live. This map shows those neighborhoods at a very high risk of undercounting young children and whose most recent self-response rates were very low (<50%) in dark gray. In light gray you see neighborhoods at very high risk of undercounting young children and where rates are low (between 50% and 64%). The red circles represent the estimated number of young children living in these tracts. Though ideally, we’d extend our outreach to the entire city, with only 6 weeks left, we zeroed in on four of these neighborhoods, totally nearly 3,000 young children, most of which are in the southeast part of the city. This area has been historically undercounted, has lower overall socioeconomic status, and the majority of residents are black. This is also where we see the greatest health disparities, particularly in our children, and have relationships with many organizations located there. Not surprisingly, many of these neighborhoods have low or no internet access.
Using geospatial analysis, we located places of worship, hospitals and health centers, and sites providing DC Free WiFi outdoors to the public. Since many places are closed, we hope outdoor WiFi locations will overcome some of the barriers to completing the census online. We compiled a list of these organizations and distributed it to our Census Ambassadors. Our intention is to approach these neighborhoods from many directions and flood it with the message to “Complete your census and include all babies and young children.” The PRB research allows us to know that the driving factor behind the increased risk in these neighborhoods is that many households are headed by single females, with no spouse present. In one of our priority neighborhoods the driving factor is immigrant households. Using this information, we can target our outreach messages to the residents living there.